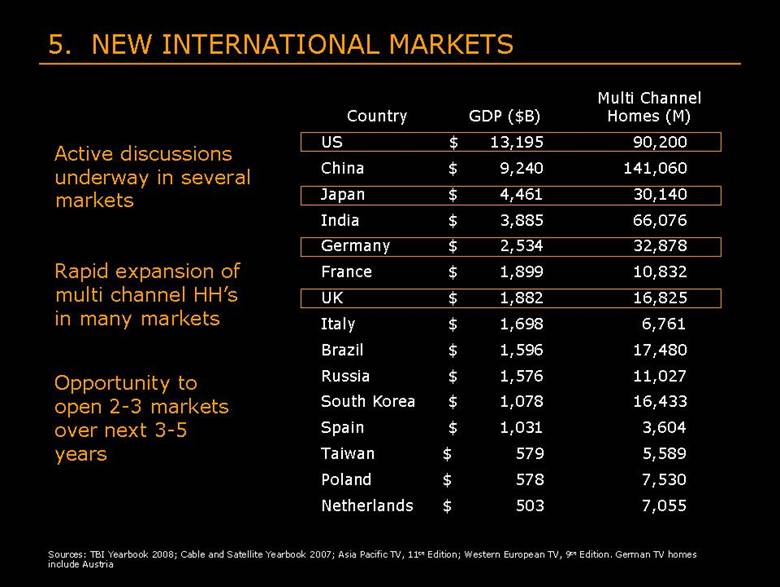
Filed by Liberty Media Corporation


Pursuant to Rule 425 under the Securities Act of 1933


and deemed filed pursuant to Rule 14a-6 of the Securities Exchange Act of 1934


Subject Company:  Liberty Media Corporation


Registration Statement File No.: 333-145936


GRAPHIC

Liberty Media Investor Meeting 9.21.2007


Today’s Agenda 09:00 – 09:15 Liberty Interactive Greg Maffei 09:15 – 09:45 QVC Michael George 09:45 – 10:00 Provide Commerce Jonathan Sills 10:00 – 10:10 BUYSEASONS Jalem Getz 10:10 – 10:20 Backcountry.com Jim Holland 10:20 – 10:40 Break 10:40 – 11:10 Liberty Capital/ Greg Maffei Liberty Entertainment 11:10 – 11:30 Starz Bob Clasen 11:30 – 11:45 FUN/GSN David Goldhill 11:45 – 12:15 DirecTV Chase Carey 12:15 – 1:00 Conclusion and Q&A John Malone/Greg Maffei


GRAPHIC

Forward-Looking Statements This presentation includes certain forward-looking statements within the meaning of the Private Securities Litigation Reform Act of 1995, including statements about financial guidance, business strategies, market potential, future financial performance, new service and product launches and other matters that are not historical facts. These forward-looking statements involve many risks and uncertainties that could cause actual results to differ materially from those expressed or implied by such statements, including, without limitation, possible changes in market acceptance of new products or services, competitive issues, regulatory issues, continued access to capital on terms acceptable to Liberty Media and the satisfaction of the conditions to the reclassification of Liberty’s existing tracking stock structure. These forward-looking statements speak only as of the date of this presentation, and Liberty Media expressly disclaims any obligation or undertaking to disseminate any updates or revisions to any forward-looking statement contained herein to reflect any change in Liberty Media’s expectations with regard thereto or any change in events, conditions or circumstances on which any such statement is based. Please refer to the publicly filed documents of Liberty Media, including the most recent Form 10-Q for additional information about Liberty Media and about the risks and uncertainties related to Liberty Media’s business which may affect the statements made in this presentation. At today’s meeting we will discuss certain non-GAAP financial measures. Please refer to the Appendix at the end of this presentation for definitions of EBITDA and OCF as well as applicable GAAP reconciliations. The Appendix will also be available on our website www.libertymedia.com throughout this conference. Additional Information Nothing herein shall constitute a solicitation to buy or an offer to sell shares of the reclassified Liberty Capital tracking stock or Liberty Entertainment tracking stock.  The offer and sale of Liberty’s tracking stocks in the proposed reclassification will only be made pursuant to its effective registration statement.  Liberty stockholders and other investors are urged to read the registration statement, including the proxy statement/prospectus contained therein, filed by Liberty with the SEC on September 7, 2007, because it contains important information about the transaction.  A copy of the registration statement including the proxy statement/prospectus is available free of charge at the SEC’s website (http://www.sec.gov). Participants in Solicitation The directors and executive officers of Liberty and other persons may be deemed to be participants in the solicitation of proxies in respect of proposals to approve the reclassification.  Information regarding Liberty’s directors and executive officers and other participants in the proxy solicitation and a description of their direct and indirect interests, by security holdings or otherwise, are available in the proxy statement/prospectus filed by Liberty with the SEC.


GRAPHIC

Liberty Evolves Gregory B. Maffei President and CEO


GRAPHIC

2004 Status Liberty Media – holding company Complex story US and international assets Distribution, content, telecom, media, and technology Controlled and non-controlled assets Wide discount to NAV Low tax basis Complexity = challenge to analyze Difficult strategic story


GRAPHIC

2004 - Plethora of Brands


GRAPHIC

Ch, Ch, Changes... 2004: Separated ownership of international distribution and programming assets via spin-off of Liberty Media International LMI later merged with UGC to form Liberty Global 2005: Separated ownership of Ascent Media Group and 50% interest in Discovery Communications via spin-off of Discovery Holding Company (DHC) Discovery Communications repurchased Cox Communications 25% interest (May 2007) DHC now owns 2/3rds of DCI 2006: Issued Liberty Capital and Liberty Interactive tracking stocks 2007: Plan to split Liberty Capital into Liberty Entertainment and new Liberty Capital tracking stocks


GRAPHIC

2004 Spin-off 2005 Spin-off 2006 Tracker 2006 Tracker 2007 Tracker Spin-offs and Trackers


GRAPHIC

Liberty Performance Since LMI Spin-off $- $2.00 $4.00 $6.00 $8.00 $10.00 $12.00 $14.00 $16.00 $18.00 “L” equivalent May-04 Sep-04 Jan-05 May-05 Sep-05 Jan-06 May-06 Sep-06 Jan-07 May-07 Sep-07 LBTYA/K DISCA L LCAPA LINTA


GRAPHIC

Liberty Out-Performance Liberty vs. Peers -20% -10% 0% 10% 20% 30% 40% 50% 60% 70% 5/31/04 5/31/05 5/31/06 9/20/07 Aggregate return L equiv NWS/A DIS VIA-CBS TWX 15% CAGR


GRAPHIC

2008 Objectives and Strategy “New” Liberty Capital Simplify Rationalize non-core assets (tax-efficiently) Liberty Entertainment Create fairly-valued currency to enable strategic flexibility Use distribution to drive content and strategic opportunities Liberty Interactive Grow existing operations Expand e-commerce businesses Rationalize non-consolidated assets (tax-efficiently) Make strategic acquisitions / brand investments Shrink equity


GRAPHIC

Liberty Evolves Gregory B. Maffei President and CEO Investor Meeting 9.21.2007


GRAPHIC

Evolution Since May 2006 Strategic Acquisitions Provide Commerce BUYSEASONS Backcountry.com Equity Shrink $1 billion open market share repurchases $500 million self tender Growth Strategies Enhance brand awareness Leverage market position strategic investments Evaluate new markets and platforms


GRAPHIC

Liberty Interactive Today


GRAPHIC

Today’s Special Value: ($ in billions) Liberty Interactive market cap $11.9 Adjustments: IAC stake (2.0) EXPE stake (2.1) GSI stake & other (0.3) Other e-commerce subs (cost) (0.6) Net debt 5.8 Implied QVC Enterprise Value 12.9 EV / trailing 12 months OCF 7.7x


GRAPHIC

QVC Compares Favorably Trailing twelve months OCF growth entirely organic (no new stores) Trailing twelve months OCF growth rate depressed by International Cap ex cycle peaking OCF – Cap ex yield expected to increase Source: Bloomberg, Stock Prices at 9/20/07; Other data: 12 months trailing using most recently available. TTM 6/30/07 OCF TTM OCF GR% TTM OCF - CAPEX EV / TTM OCF EV / TTM OCF - CAPEX TTM OCF - CAPEX YLD OCF Multiple to Growth eBay $2.3 22.2% $1.8 21.1x 26.2x 3.6% 1.0x Amazon 0.7 41.7% 0.5 49.5x 66.9x 1.5% 1.2x Costco 2.1 3.2% 0.8 11.7x 31.5x 3.0% 3.6x JC Penney 2.4 16.2% 1.4 6.8x 12.1x 9.2% 0.4x Nordstrom 1.2 13.8% 0.9 11.2x 16.1x 6.9% 0.8x Kohls 2.4 23.2% 0.9 8.4x 22.2x 4.8% 0.4x WAVG (EV) $1.8 22.5% $1.1 22.3x 33.5x 4.0% 1.3x QVC $1.7 11.3% $1.4 7.5x 9.3x 11.4% 0.7x


GRAPHIC

Action Plan Drive operational excellence Pursue growth initiatives Geographic and platform expansion Brand enhancement Internet Rationalize equity stakes tax efficiently Utilize capital Strategic acquisitions and growth initiatives Equity shrink Maintain optimal capital structure Optimize financial flexibility


GRAPHIC

E-commerce Assets Undervalued High growth assets with strong cash flow characteristics Category leaders Strong management teams Acquired at reasonable prices Provide Commerce, BuySeasons and BackCountry acquired for ~$600m Implied OCF multiples are low relative to historical and expected growth rates


GRAPHIC

QVC Mike George President & CEO


GRAPHIC

STRONG GROWTH TRACK RECORD 1987 1988 1989 1990 1991 1992 1993 1994 1995 1996 1997 1998 1999 2000 2001 2002 2003 2004 2005 NET SALES 2006 $7.1B $1.7B EBITDA


GRAPHIC

8% average revenue growth - With only 2% sub growth and flat HH penetration 2001-2006 AVG +7.9% +8.7% +3.8% +7.7% +12.0% +7.4% 2004 2005 2006 2002 2003 0.0% 5.0% 10.0% SUSTAINED U.S. GROWTH AT FULL DISTRIBUTION 11% average EBITDA growth -  Stable/growing gross margins despite revenue variability Quarterly revenue variability higher -  Execution, LY comp’s, category trends, consumer spending, long-term orientation  Q1 Q1 Q1 Q1 Q1 Q1 Q2 Q2 Q2 Q2 Q2 Q2 Q3 Q3 Q3 Q3 Q4 Q4 Q4 Q4 Q4 Q3


GRAPHIC

-4% 7% new customers (1.7-1.9mm per year) 38% +7% Annual customer count growth THREE YEAR AVERAGE ENDING JUNE 2007 Sales contribution Annual Retention rate +6% 79% core customers (10+/yr purchases) 96% +4% +2% 14% occasional customers (1-9x/yr purchases) 47% +5% +1% total 100% 59% +8% Annual $/customer growth INCREASING CUSTOMER SPEND DRIVES GROWTH


GRAPHIC

Consistent execution of the fundamentals: -  Compelling products at great values, engaging programming, newness & diversity -  Price integrity -  No hard sell Additional focus on product/program diversity in Germany & Japan given recent market challenges EBITDA margin expansion (esp. Int’l) through productivity, fixed cost leverage, other initiatives MANAGING GROWTH & MARGIN EXPANSION -  Service beyond expectations -  Community


GRAPHIC

GROWTH PILLARS ELEVATE THE BRAND INTO THE TRUSTED SHOPPING AUTHORITY 1. Updated Brand Identity/Expanded Marketing Programs 2. Leadership Brands & Distinctive Items MAKE QVC THE PREEMINENT MULTIMEDIA RETAILER 3. Unmatched Multi Channel Experience  4. Enhanced Social Network 5. New International Markets EXPAND INTO ADJACENT GROWTH ARENAS 6. Brand Alliances/Network Monetization 7. New Forms of Video Retailing


GRAPHIC

1.8M core 31.0M target 7.4M actives 90.2M cable/DBS universe 1.  BRAND IDENTITY / MARKETING Extensive research to codify brand values and define market opportunity I. DELIGHT CORE CUSTOMERS II. NURTURE OCCASIONAL CUSTOMERS III. ATTRACT NEW CUSTOMERS THREE BRANDING GOALS:


GRAPHIC

UPDATING THE BRAND IDENTITY 1987 1988 1989 1990 1991 1992 1993 1994 1995 1996 1997 1998 1999 2000 2001 2002 2003 2004 2005 2006 $7.1B The evolution of QVC’s brand has not kept with evolution of its business.


GRAPHIC

BRAND IDENTITY Works across all platforms; dynamic multimedia applications Suggests feeling of a ribbon unfolding or package opening Helps us own the “Q” – our customers’ shorthand for QVC THE RIBBON LOGO


GRAPHIC

BRAND IDENTITY before after


GRAPHIC

BRAND IDENTITY before after


GRAPHIC

BRAND IDENTITY before after


GRAPHIC

BRAND IDENTITY before after


GRAPHIC

BRAND EXPRESSION


GRAPHIC

BRAND EXPRESSION


GRAPHIC

BRAND ADVERTISING


GRAPHIC

TEASER CAMPAIGN


GRAPHIC

TEASER CAMPAIGN


GRAPHIC

TEASER CAMPAIGN


GRAPHIC

GROWTH PILLARS ELEVATE THE BRAND INTO THE TRUSTED SHOPPING AUTHORITY 1. Updated Brand Identity/Expanded Marketing Programs 2. Leadership Brands & Distinctive Items MAKE QVC THE PREEMINENT MULTIMEDIA RETAILER 3. Unmatched Multi Channel Experience  4. Enhanced Social Network 5. New International Markets EXPAND INTO ADJACENT GROWTH ARENAS 6. Brand Alliances/Network Monetization 7. New Forms of Video Retailing


GRAPHIC

2. LEADERSHIP BRANDS & DISTINCTIVE ITEMS national brands exclusive diffusion lines proprietary brands 2006 2007 RESPECTED BRANDS & PERSONALITIES


GRAPHIC

CULTIVATING THE ITEM BUSINESS 2.  LEADERSHIP BRANDS & DISTINCTIVE ITEMS


GRAPHIC

3. UNMATCHED MULTI CHANNEL EXPERIENCE New Platforms to Extend Reach Dish Channel Position: July ‘07 Cable VoD: test ‘08 HD Tier – ‘08/‘09 AOL - ‘06 YouTube – Fall ‘07 New Platforms to Increase Convenience, Capability & Control Adobe desktop widget: ‘08 Interactive buy button: UK ‘03, US test ‘08 Mobile: JN ‘05, UK ‘07, US ‘08 Interruptive Marketing RSS: ‘07 SMS: ‘08 Next Generation Internet Shopping Experience QVC.com relaunch: Oct ‘07 Digital Infrastructure Live Content Repurposed VoD Content Original Content Dynamic Live Show Compelling destination programming Improved look New remote production sets, graphics, visual mdsg: ‘07 - NFL, Runway: ‘07 capabilities: ‘07


GRAPHIC

INDUSTRY LEADING WEB/VIDEO INTEGRATION


GRAPHIC

INDUSTRY LEADING WEB/VIDEO INTEGRATION


GRAPHIC

ENHANCED SHOPPING TOOLS


GRAPHIC

ENHANCED SHOPPING TOOLS


GRAPHIC

For customers, vendors, designers & hosts Leveraged content unique to QVC A SOCIAL SHOPPING DESTINATION 4.  ENHANCED SOCIAL NETWORK Voting ENGAGE WITH THE LIVE SHOW Ask Us ENGAGE WITH PERSONALITIES Blogs Live Chats Moderated Forums Product  Reviews ENGAGE WITH EACH OTHER Polls Virtual Shopping Experiences


GRAPHIC

GROWTH PILLARS ELEVATE THE BRAND INTO THE TRUSTED SHOPPING AUTHORITY 1. Updated Brand Identity/Expanded Marketing Programs 2. Leadership Brands & Distinctive Items MAKE QVC THE PREEMINENT MULTIMEDIA RETAILER 3. Unmatched Multi Channel Experience 4. Enhanced Social Network 5. New International Markets EXPAND INTO ADJACENT GROWTH ARENAS 6. Brand Alliances/Network Monetization 7. New Forms of Video Retailing


GRAPHIC

5. NEW INTERNATIONAL MARKETS Active discussions underway in several markets Rapid expansion of multi channel HH’s in many markets Opportunity to open 2-3 markets over next 3-5 years 7,055 $ 503 Netherlands 7,530 $ 578 Poland 5,589 $ 579 Taiwan 3,604 $ 1,031 Spain 16,433 $ 1,078 South Korea 11,027 $ 1,576 Russia 17,480 $ 1,596 Brazil 6,761 $ 1,698 Italy 16,825 $ 1,882 UK 10,832 $ 1,899 France 32,878 $ 2,534 Germany 66,076 $ 3,885 India 30,140 $ 4,461 Japan 141,060 $ 9,240 China 90,200 $ 13,195 US Multi Channel Homes (M) GDP ($B) Country Sources: TBI Yearbook 2008; Cable and Satellite Yearbook 2007; Asia Pacific TV, 11th Edition; Western European TV, 9th Edition. German TV homes include Austria


GRAPHIC

6.  BRAND ALLIANCES / NETWORK MONETIZATION CREATING WIN-WIN PARTNERSHIPS WITH BRANDS THAT BENEFIT FROM THE QVC NETWORK EFFECT Royalties Warrants Equity investments


GRAPHIC

7. NEW VIDEO/INTERNET SHOPPING MODELS EVALUATING NEW SHOPPING PLATFORMS IN PARTNERSHIP WITH OTHER TRAFFIC AGGREGATORS


GRAPHIC

QVC Mike George President & CEO Liberty Investor Meeting 9.21.2007 


GRAPHIC

provide-commerceTM Jonathan Sills Senior Vice President Strategy and Corporate Development


GRAPHIC

Collection of branded websites each offering high quality, perishable products shipped fresh from the supplier to the consumer  Designed specifically around the way consumers shop  Our proprietary technology allows us to eliminate multiple intermediaries from the legacy supply chain, thereby realizing significant cost advantages and higher margins  provide-commerceTM


GRAPHIC

Size of the Floral Market and Growth Trends The U.S. Department of Commerce’s Bureau of Economic Analysis estimates the size of the floriculture industry at retail to be about $19.4 billion. The floricultural market has grown at an average annual pace of +4.1% over the last 10 years Online floral sales represent approximately    $1 billion of the overall floral market


GRAPHIC

Business Model Advantages Consumer Benefits Supplier Benefits Internet-enabled:  NOT order aggregators Direct from the supplier Virtual model Removes cost from transaction Overnight delivery via FedEx/UPS Enhanced profitability Broader customer reach Monthly feedback Improved quality Optimize production Great value 7-day freshness guarantee Prime varieties Accurate fulfillment 3 confirmation e-mails


GRAPHIC

Business Strategy Highlights Focus on the Customer Ongoing website improvements Ongoing investment in quality Optimize the Core Business Increase AOV and conversion Product development and portfolio optimization


GRAPHIC

Revenue and EBITDA Percentage Growth CY05,06,07 (1st half) Revenue EBITDA provide-commerceTM Provide was acquired by Liberty effective 2/06 0.0% 5.0% 10.0% 15.0% 20.0% 25.0% 30.0% 35.0% 2005 2006 2007 0.0% 10.0% 20.0% 30.0% 40.0% 50.0% 60.0% 2005 2006 2007


GRAPHIC

Growth Opportunities Going Forward Continue to gain market share in the flower industry Build out other brands International expansion


GRAPHIC

“Wins” through Liberty Learning how to market through television more effectively Scale efficiencies from managing vendor contracts Best practice sharing with other companies, as well as one of the brightest minds in all the business world


GRAPHIC

BuySeasons, Inc. Jalem M. Getz President and CEO


GRAPHIC

About BuySeasons, Inc. Founded in 1999 Largest retailer and supplier for Costumes, Halloween and Party merchandise on the Internet BuyCostumes.com is the #1 destination for Costumes and Halloween products on the internet Buy-Seasons Direct only end-to-end Halloween and Party supplier for large “e” retailers like Target.com and Grandin Road


The Halloween Market Halloween fastest growing (retail) holiday in the U.S. Halloween costumes and decorations approximately $3 billion marketplace in U.S. Second most decorated holiday of the year Mass market retailers challenged in addressing shifting demand Young adults (18-24) are the fastest growing demographic Consumer spending on Halloween has increased 20% per year since 2003 Source: NRF


GRAPHIC

Business Model Advantages Consumer Benefits Retail Partner Benefits Largest assortment Halloween Costumes and Party Supplies on the internet Competitive pricing reflecting quality and availability Focus on customer web experience and support Cost effective and rapid delivery (closest delivery time to Halloween day) in the US and Canada Large assortment without inventory investment No markdown risk Private Label solution Industry leader in fulfillment turnaround and accuracy


GRAPHIC

Business Strategy Highlights 2007 Build exclusivity with private label and exclusive products Highly scalable retail drop-ship network Grow décor and party supply business Relentless focus on the customer Hairspray costumes and wigs sold exclusively at BuyCostumes.com


GRAPHIC

Revenue and EBITDA Percentage Growth CY05,06,07 (1st half) Revenue EBITDA NA BuySeasons was acquired by Liberty effective 8/06 0% 20% 40% 60% 80% 100% 2005 2006 2007 0% 20% 40% 60% 80% 100% 2005 2006 2007


GRAPHIC

Growth Initiatives Expanding International Capabilities to ship to UK and Australia (Halloween markets growing even faster than the US) Increase penetration into synergistic party and decor markets BUYSEASONS-Direct Expansion with new retailers Expansion into synergistic specialty and seasonal merchandise categories


GRAPHIC

“Wins” through Liberty Starz Fear Fest promotion - 2006 and 2007 Discovery Licensing – Animal Planet and other Discovery branded costumes for 2008. Wide assortment of costumes on QVC.com 2006, 2007 QVC on air September 2007 Commerce Hub Party and Costume partner


GRAPHIC

Backcountry.comTM Jim Holland CEO/Co-Founder


GRAPHIC

Founded in 1996 with $2,000 investment Run six category-leading online stores that focus on high-end outdoor gear, snowboarding, skiing and closeout gear Fastest growing, action sports online retailer Average revenue growth 90%, Average EBITDA growth 150%, 2003-2006 Offer 120,000 products from over 475 brands Backcountry.comTM


GRAPHIC

Brands We Offer


GRAPHIC

Awards and Recognitions BizRate "Circle of Excellence" Platinum Award — 2004, 2005, 2006 Internet Retailer Top 50 Best of the Web for 2003 and 2006 Named to Inc. Magazine's Inc. 500 list of the fastest growing privately held businesses in 2004 and 2006 Named one of the top 25 retailers by Outdoor Business in 2004 and 2005


GRAPHIC

Our Philosophy Use the gear we sell & sell the gear we love Provide the best customer experience imaginable Continuously innovate and evolve


GRAPHIC

Sporting Goods Industry is Huge Estimated Addressable Market for Sporting Goods, 2000-2006E Compound Annual Growth Rate 2000-2005E: 2.5% 2005E-2010E: 2.2% $11.0 $10.2 $9.8 $10.5 $11.2 $11.6 $11.8 $13.0 $13.8 $14.1 $14.4 $14.8 $15.0 $15.3


GRAPHIC

Revenue and EBITDA Growth (FY2004-07) Revenue (% Growth) EBITDA (% Growth) Backcountry.com was acquired by Liberty effective 6/07 33% 99% 154% 0% 20% 40% 60% 80% 100% 120% 140% 160% 180% 2005 2006 1H2007 90% 56% 75% 0% 10% 20% 30% 40% 50% 60% 70% 80% 90% 100% 2005 2006 1H2007


GRAPHIC

Opportunities/Challenges Hiring the best people Customer generated content Building Customer Loyalty Developing House Brands International Expansion One-Deal-at-a-Time Site Potential


GRAPHIC

Wins through Liberty Correlations between QVC and our ODAT sites Leveraging larger scale for better pricing on contracts Sharing ideas and comparing metrics across companies Financial support for small acquisitions


GRAPHIC

"We Use The Gear We Sell®" Backcountry.com staff using the gear we sell:


GRAPHIC

Liberty Evolves Gregory B. Maffei President and CEO


GRAPHIC

Evolution Since May 2006 Tax efficient restructurings News Corp exchange (pending) CBS exchange IDT exchange Time Warner exchange Simplifying transactions On Command sale OpenTV sale Equity shrink $1.3 billion self-tender Reduced complexity Derivative unwinds and expirations Announced Liberty Entertainment tracker


GRAPHIC

Liberty Capital Tracker Today


GRAPHIC

Liberty Capital Tracker Spawning New Starz Media TruePosition Atlanta Braves Time Warner Sprint Other DirecTV Starz/Encore Regional Sports Networks Fun GSN WildBlue


GRAPHIC

Liberty Entertainment Rationale Create currency for acquisitions Focus synergistic entertainment business Improve transparency Contain complexity to new Liberty Capital tracker Highlight discount to NAV Enhance shareholder choice Unlock value


GRAPHIC

Missing Value? ~25% discount Unlock the gap Public assets: DirecTV $11.5 Time Warner 1.7 Sprint 1.4 Other & derivatives 2.4 Public asset market value $17.0 Private assets: (analyst consensus) Starz Entertainment $2.5 RSNs 0.6 Atlanta Braves 0.5 Starz Media 0.4 TruePosition 0.3 GSN 0.2 Other 0.2 Private asset market value $4.9 Net debt (pro forma News deal) (1.3) LCAPA equity value (NAV) $20.6 $15.7 Valuation Gap $4.9 Current LCAPA market value


GRAPHIC

Liberty Entertainment Action Plan Create strong currency for acquisitions Make strategic acquisitions Content Distribution Optimize capital structure Leverage cash flow Shrink equity


GRAPHIC

Liberty Capital Action Plan Rationalize non-core attributed assets (tax-efficiently) Convert non-core assets to cash and controlling interests in operating businesses Capital structure optimization Financial flexibility Potential equity shrink


GRAPHIC

New Liberty Capital - Value of Attributed Assets Market value of public securities and derivatives ~$5.4 billion Three largest operating businesses estimated to be worth at least $1.0-1.5 billion (with relatively high tax basis) Other private assets have meaningful value Net debt ~$2.0 billion Deferred tax liabilities Need / opportunities to restructure tax efficiently


GRAPHIC

Starz, LLC Robert Clasen Chairman & CEO


GRAPHIC

The New Starz: Controlling Our Own Destiny


GRAPHIC


GRAPHIC

Subscriber Growth Starz and Encore Compound Annual Growth Rate between 2003 and 2005 was 6.9% and 8.4%, respectively 12.3 21.9 14.1 24.5 14.1 25.8 0 5 10 15 20 25 30 Subscribers (in millions) 2003 2004 2005 Starz Encore


GRAPHIC

Starz: In 2005 #10 of 73 Basic and Pay Channels in HH Coverage Rating Rank Channel HH Rating Rank Channel HH Rating Rank Channel HH Rating 1 Nickelodeon* 1.8 21 Court TV* 0.5 44 Discovery Health 0.2 2 TNT 1.2 21 Sci Fi 0.5 44 SoapNet 0.2 2 Cartoon Network* 1.2 21 Food Network* 0.5 44 Oxygen* 0.2 2 HBO 1.2 21 HGTV* 0.5 44 TV1 0.2 4 Disney Channel 1.1 21 CNN 0.5 44 National Geographic* 0.2 5 Lifetime* 1.0 21 Showtime 0.5 44 Nicktoons 0.2 5 USA 1.0 31 BET 0.4 56 Versus 0.1 7 TBS 0.9 31 TLC* 0.4 56 The Outdoor Channel 0.1 7 Fox News Channel 0.9 33 Sportsouth 0.4 56 CNBC* 0.1 7 Cinemax 0.9 34 E!* 0.3 56 Golf Channel 0.1 10 Starz 0.7 34 Weather Channel 0.3 56 ESPN Classic 0.1 10 ESPN 0.7 34 VH1 0.3 56 Speed 0.1 10 Hallmark Channel* 0.7 34 Animal Planet 0.3 56 ESPN News 0.1 13 MTV 0.6 34 WGN Superstation* 0.3 56 Great American Country* 0.1 13 ABC Family* 0.6 34 GSN* 0.3 56 Style Channel* 0.1 13 A&E* 0.6 34 ESPN2 0.3 56 BBC America 0.1 13 Spike* 0.6 34 Toon Disney 0.3 56 Discovery Times 0.1 13 FX* 0.6 34 MSNBC 0.3 56 Discovery Science 0.1 13 TV Land 0.6 34 NOGGIN/The N 0.3 56 Military Channel 0.1 13 Lifetime Movie Network 0.6 44 Headline News 0.2 56 G4* 0.1 13 History Channel* 0.6 44 TV Guide Network 0.2 56 Biography* 0.1 21 Encore 0.5 44 Bravo* 0.2 56 History International* 0.1 21 Discovery* 0.5 44 CMT 0.2 56 MTV2 0.1 21 AMC 0.5 44 Travel Channel 0.2 73 Fit TV 0.0 21 Comedy Central* 0.5 44 WE* 0.2 73 Fuse 0.0 SOURCE: Nielsen NPower. Ranked on household coverage rating percentage, total day (M–Su 6A–6A), January–December, 2005. Subject to qualifications available on request. 2005 Total Day Basic and Premium Channel Ranking Households Note: Includes all networks programming at least 51% of the daypart. Networks with asterisks (*) do not program the entire daypart.


GRAPHIC

Revenue Flattening $0 $50 $100 $150 $200 $250 $300 $ millions 4Q’04 1Q’05 2Q’05 3Q’05 4Q’05 1Q’06


GRAPHIC

Programming Costs Increasing $0 $100 $200 $300 $400 $500 $600 $700 $ millions 2002 2003 2004 2005


GRAPHIC

Reducing Cash Flow $0 $100 $200 $300 $400 $500 $600 $700 $ millions 2002 2003 2004 2005 Programming Operating Cash Flow


GRAPHIC

Programming Costs Now Declining $290 $300 $310 $320 $330 $340 $350 $360 $ millions 1H’06 2H’06 1H’07


GRAPHIC


GRAPHIC

Continued Subscriber Growth 12.3 21.9 14.1 24.5 14.1 25.8 15.5 27.3 16.1 28.4 0 5 10 15 20 25 30 Subscribers (in millions) 2003 2004 2005 2006 2Q’07 Starz Encore


GRAPHIC

Cash Flow Improving $0 $20 $40 $60 $80 $100 $120 $140 2H’05 1H’06 2H’06 1H’07


GRAPHIC

Starz: In First Half of 2007 #12 of 76 Basic and Pay Channels in HH Coverage Rating Rank Channel HH Rtg Rank Channel HH Rtg Rank Channel HH Rtg 1 Nickelodeon* 1.8 19 TV Land 0.5 46 Biography* 0.2 2 Disney Channel 1.3 19 HGTV* 0.5 46 SoapNet 0.2 3 USA 1.1 29 Encore 0.4 46 Oxygen* 0.2 3 TNT 1.1 29 BET 0.4 46 MTV2 0.2 5 Cartoon Network* 1.0 29 VH1 0.4 46 TV One 0.2 5 HBO 1.0 29 TLC* 0.4 46 Speed 0.2 7 Lifetime* 0.8 29 Lifetime Movie Network 0.4 46 WE* 0.2 7 TBS 0.8 29 Showtime 0.4 46 Versus 0.2 7 Fox News Channel 0.8 35 E!* 0.3 61 Outdoor Channel 0.1 10 A&E* 0.7 35 The Weather Channel 0.3 61 TV Guide Network 0.1 10 Hallmark Channel* 0.7 35 Bravo* 0.3 61 Golf Channel 0.1 12 Starz 0.6 35 Animal Planet 0.3 61 ESPN Classic 0.1 12 ESPN 0.6 35 WGN Superstation* 0.3 61 ESPN News 0.1 12 Discovery* 0.6 35 GSN* 0.3 61 Great American Country* 0.1 12 Court TV* 0.6 35 ESPN2 0.3 61 Style* 0.1 12 FX* 0.6 35 Toon Disney 0.3 61 BBC America 0.1 12 History Channel* 0.6 35 MSNBC 0.3 61 Discovery Times 0.1 12 Cinemax 0.6 35 NOGGIN/The N 0.3 61 Military Channel 0.1 19 MTV 0.5 35 National Geographic* 0.3 61 G4* 0.1 19 ABC Family* 0.5 46 Headline News 0.2 61 History International* 0.1 19 CNN 0.5 46 CNBC* 0.2 61 NFL Network 0.1 19 Spike* 0.5 46 CMT 0.2 74 Fit TV << 19 AMC 0.5 46 Travel Channel 0.2 74 Fuse << 19 Food Network* 0.5 46 Discovery Science 0.2 74 VH1 Classic << 19 Comedy Central 0.5 46 Nicktoons 0.2 19 Sci Fi 0.5 46 Discovery Health 0.2 Note: Includes all networks programming at least 51% of the daypart. Networks with asterisks (*) do not program the entire daypart. 2007 Total Day Basic and Premium Channel Ranking January–June Household Coverage Rating Average SOURCE: Nielsen Market Breaks Live + 7 household coverage ratings. Ranked on household coverage rating percentage, total day (M–Su 6A–6A), January–June, 2007. Subject to qualifications available on request.


GRAPHIC

Starz Originals


GRAPHIC

Starz Media


GRAPHIC

Anchor Bay


GRAPHIC


GRAPHIC

Overture Films


GRAPHIC

Other Starz Media Units Everyone’s Hero Slacker Cats Wow! Wow! Wubbzy Nine King of the Hill Sands of Oblivion Veggie Tales The Simpsons Masters of Science Fiction


GRAPHIC

Space Chimps


GRAPHIC

The New Starz Starz Media Starz Entertainment Linear On Demand Internet HD


GRAPHIC

GSN & Fun Technologies David Goldhill President & CEO – GSN Chairman – FUN Technologies


GRAPHIC

50/50 joint venture with Sony Pictures Entertainment Publicly traded company; LSE (AIM): FUN TSX: FUN Liberty Interest 53% Businesses: FUN Games Fun Sports Don Best


GRAPHIC

GSN Only games-centric cable network 65.8 million US TV homes 0.3 full-day HH rating 23.4 minutes average length of tune-in 700K monthly uniques on GSN.com casual games site


GRAPHIC

Cost-effective programming with timeless appeal GSN original game shows Exclusive cable rights to the largest classic game show libraries Acquired major modern game show brands


GRAPHIC

GSN.com casual games site Sources: ComScore Media Metrix, July 2007; GSN internal reporting 4.9 million registered users 700K monthly uniques 5.0 million casual game plays per month 475K skill game plays per month on WorldWinner


GRAPHIC

Stable but highly engaged audience HH RATINGS A25-54 RATINGS Source: Nielsen; length of tune-in rankings out of 62 major basic cable networks on full-day HH basis LENGTH OF TUNE-IN GSN = 23.4 minutes avg. HALL LIFE GSN COURT FAM WE OXYG G4 RANK 1 7 10 13 23 35 36 50 0.00 0.05 0.10 0.15 0.20 0.25 0.30 0.35 0.40 1Q04 2Q04 3Q04 4Q04 1Q05 2Q05 3Q05 4Q05 1Q06 2Q06 3Q06 4Q06 1Q07 2Q07


GRAPHIC

But a broader opportunity TV game show board game casual game slot machine mobile game


GRAPHIC

GSN strategy Large potential market: 54 million US casual gamers and growing Fit with GSN demographic Affinity for GSN content Available across all platforms Strong potential partners Unique asset: TV network in 65.8 million homes Embrace the core Tighten focus on casual games and game show content Service the core GSN demographic both on air and online


GRAPHIC

Emerging leader in two fast growing sectors of legal online games: Skill-based games Fantasy sports 30 million registered customers FUN Technologies (000) Source: FUN Technologies REVENUE Q207 Q205 Q206 $2,827 $4,348 $7,929 $10,117 $7,762 $10,108 $13,154 $16,121 $14,540 $16,949


GRAPHIC

FUN Games financial performance Source: FUN Technologies (in 000) REVENUE Q207 Q205 Q206 $1,382 $1,768 $2,312 $2,341 $3,167 $5,707 $6,592 $7,217 $9,172 $10,381 $1,252


GRAPHIC

WorldWinner The leader in online competitive entertainment and skill-based online cash games


GRAPHIC

WorldWinner is an “upsell” for the most passionate online players PLAYING DAYS / MONTH: AVG. = 4 DAYS 12 DAYS+ (74% of users) Sources: ComScore Media Metrix, July 2007; WorldWinner study


GRAPHIC

Provides pay-to-play skill-based online games and tournaments All players pay entry fees, winners earn cash prizes Skill games eliminate elements of chance FairMatching™ algorithm ensures level playing field Revenue derived from tournament administration fees 20% retained by WorldWinner for administering competition Entry fees range from $1.00 to $10.00 Average entry fee = $1.90 WorldWinner business model


GRAPHIC

WorldWinner / GSN demographics Sources: ComScore Media Metrix; Acxiom study on WW top 2,500 customers; Nielsen Female comp: 72% 57% 66% Age: 25-54 80% 62% 29% Income: $30K - $75K 48% 55% 35% HH size : 3-4 17% 53% 35% Education: college 33% 22% 16% WorldWinner top 2,500 customers WorldWinner all unique visitors GSN TV audience


GRAPHIC

GSN and FUN collaborations Sources: WW reporting, 117% increase is weekly average during the 13-week promotion compared to the 5-weeks immediately prior GSN.com skill games players compete exclusively on the WorldWinner platform Lingo tournament promotion Online champion becomes TV contestant Involves all WW affiliate site players (GSN, AOL, MSN, Pogo) Lingo rose to #1 word game, top-5 game overall on WW 117% increase in cash account activations


GRAPHIC

Fantasy sports overview Over 10 million fantasy football players, and over 3 million fantasy baseball players in the US Desirable demographic 93% male High average income Highly engaged: Average player spends approx. 3 hours per week managing his team


GRAPHIC

FUN Fantasy Sports The only major operator with: Full spectrum of games across all major sports Fantasy sports as core offering – not ancillary (i.e. Yahoo, ESPN) Commissioner leagues: Community, competition for bragging rights Prize games: Anonymity, competition for cash prizes Draft & Play: Incorporating rivalry of Commissioner Cash prizing


GRAPHIC

The opportunity 65 million US online players, 54 million+ are casual gamers Skewed toward adult women 30+ “Sticky” sites, high frequency & duration Multiple revenue models (ad, subscription, download, cash games, virtual goods) Revenue growth outpacing rest of games segment Source: ComScore Media Metrix, July 2007


This presentation includes a presentation of operating cash flow (OCF or EBITDA), which is a non-GAAP financial measure, for QVC, Inc. and Starz Entertainment Group LLC together with a reconciliation of that non-GAAP measure to the privately held entity's operating income, determined under GAAP. Liberty defines operating cash flow as revenue less cost of sales, operating expenses, and selling, general and administrative expenses (excluding stock and other equity-based compensation). Operating cash flow, as defined by Liberty, excludes depreciation and amortization, stock and other equity-based compensation and restructuring and impairment charges that are included in the measurement of operating income pursuant to GAAP. Liberty believes operating cash flow is an important indicator of the operational strength and performance of its businesses, including the ability to service debt and fund capital expenditures. In addition, this measure allows management to view operating results and perform analytical comparisons and benchmarking between businesses and identify strategies to improve performance. Because operating cash flow is used as a measure of operating performance, Liberty views operating income as the most directly comparable GAAP measure. Operating cash flow is not meant to replace or supercede operating income or any other GAAP measure, but rather to supplement such GAAP measures in order to present investors with the same information that Liberty's management considers in assessing the results of operations and performance of its assets. Please see the schedules included below for a reconciliation for each of QVC and Starz Entertainment of operating cash flow to operating income calculated in accordance with GAAP for the applicable periods. (amounts in millions) 2003 2004 2005 2006 QVC, INC. Operating Cash Flow $ 1,013 1,230 1,422 1,656 Depreciation and Amortization (222) (437) (449) (476) Stock Compensation Expense (6) (33) (52) (50) Operating Income $ 785 760 921 1,130


(amounts in millions) Trailing 12 Months QVC, INC. Operating Cash Flow $ 1,680 Depreciation and Amortization (492) Stock Compensation Expense (25) Other Non-Cash Charges - Operating Income $ 1,163 (amounts in millions) 2002 2003 2004 2005 2006 STARZ ENTERTAINMENT GROUP LLC Operating Cash Flow $ 371 368 239 171 186 Depreciation and Amortization (69) (75) (63) (49) (26) Stock Compensation Expense (5) 130 (28) (17) 3 Other Non-Cash Charges - (157) - - - Operating Income $ 297 266 148 105 163 (amounts in millions) 2H05 1H06 2H06 1H07 STARZ ENTERTAINMENT GROUP LLC Operating Cash Flow $ 76 91 95 128 Depreciation and Amortization (26) (14) (12) (12) Stock Compensation Expense (17) - 3 (14) Operating Income $ 33 77 86 102